Thanks to Excel you can create spreadsheets that can help accountants, administrators, auditors and more professionals who have to do many accounts in the same format. Using Excel you can apply a variety of mathematical formulas such as. Add, subtract, divide, multiply, percentages and much more.
Thanks to Excel it is also possible create administrative systems to issue invoices at a point of sale, Excel is undoubtedly a powerful tool to use to the fullest.
What are pivot tables in Excel?
Le dynamic tables they are resources that can be used in Excel for data analysis, summaries and scans and can also create reports from the analyzed data.
Thanks to pivot tables in Excel, all sales of any product can be summarized and can be classified by regions, suppliers or any other preferred category. This article will describe how create a pivot table in excel.
Create pivot tables in Excel
To create a tabella pivot we must have the data that we are going to analyze with our table. For example, a table that contains the following fields: month, supplier, product, location, etc. You must select the data that we will use to create the table pivot.
Insert pivot table
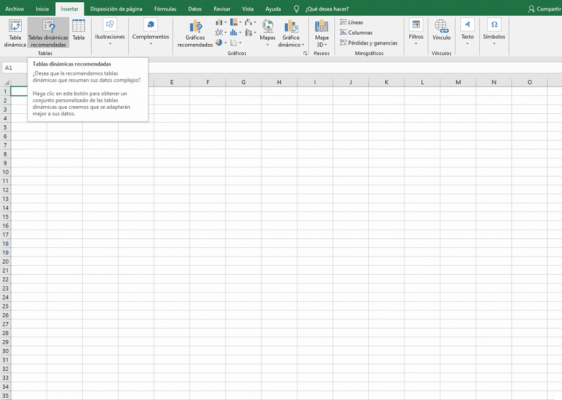
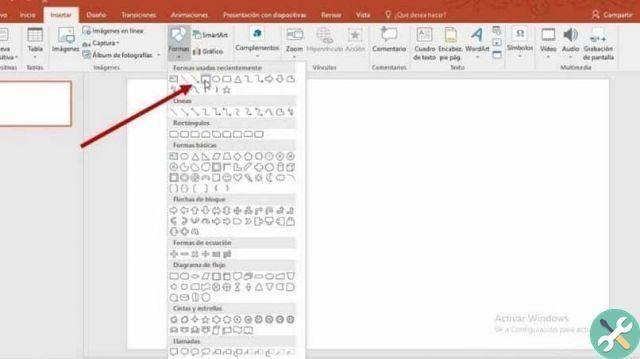
After selecting the data we want to use in ours table pivot, we need to go to the tab ribbon which is at the top of the Excel tool. You have to choose the option of insertion, which is located between the tab Home and the card Page Design.
On the left side of the options shown by the Insert tab, there is the option to insert the tabella pivot.
Select existing sheet or new worksheet

After setting up the creation of a tabella pivot, you can choose to insert it into a new sheet or choose the existing sheet where the data is located.
Set up a pivot table
Setting up a PivotTable can be made very intuitive for users of Excel, after creating the table, on the right side of the monitor you can see the configuration of the table. Start analyzing the data, for this you have to select a field and drag it to a lower part of the panel.
The panel that has a tabella pivot it is divided into two parts, the upper part is the one showing the usable fields.
The lower part of the panel shows users four available sections, in these sections it is possible to make the position of the fields.
PivotTable Tips
At first, the correct use of these tables can be a bit confusing, likewise, here are some tips so that our readers feel more comfortable when use pivot tables in Excel.
- Any kind of format can be applied to Excel pivot tables.
- When some original data is changed, the tables dynamics they need to be updated so that they adapt to the new changes.
- To easily change the formulas that summarize a pivot table, you need to right click on the table and select the option Summarize values for.
There are many things you can do in Excel and you don't get the necessary benefit, many users of Excel they don't know how to insert an image in a cell, to achieve this you need to read our article How to insert an image in Excel in a cell or with formula.