The Word application has given us an infinite number of opportunities over the years to create virtually any document we need. Indeed, it has many perhaps little-known functions, since for example this program gives us the possibility to create a creative timeline.
The uses of this program are not limited to the PC, as it also allows us to create and edit documents from the mobile, which is very useful if we do not have a computer nearby.
What are histograms used for?
The histograms they are widely used in statistics. They are particularly practical in the social sciences, as they allow you to check social data, such as the results of a census. Compare values and identify possible causes of a problem, helping to reach an effective solution more quickly.
They are always represented in the form of vertical bars, and are reflected in a horizontal axis, which represents the values of the variables in an adjacent way, and a vertical axis, which incorporates the frequencies.
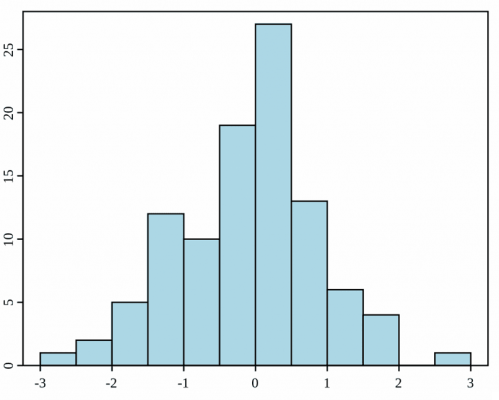
The bars are always drawn with the same width, proportional to the interval, and with the height indicated by the absolute frequency. All this information will be useful for creating a histogram yourself, regardless of whether you will create it physically or virtually. Today we are going to teach you how to create a histogram in Word, very easily.
Steps to insert a histogram in Word
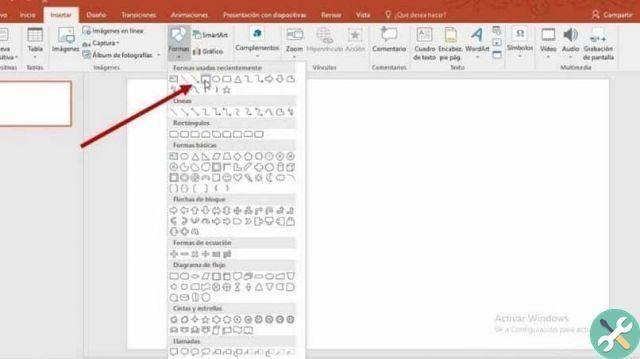
Although it is also possible to create a histogram in Excel, There are two ways to insert or create histograms in Word. Both ways are very easy to apply and will give you excellent results. The options are included in the "Insert" tab, in the "Graphics" button. Once placed there, you can choose to create the histogram in the “Column” section or in the “Histograms” section.
If you want to do it from the section that bears the name ¨ Column ¨ devi:
- Choose the graphics in the options that appear at the top of the newly opened window and click on "Accept". An internally programmed Excel window will open in Word, to start entering data.
- Enter your statistical data in the appropriate columns.
- Close the window and you will immediately see the chart in Word.
To create your chart from section ¨ Histogram ¨ you will need to do the following:
- Choose the histogram template you prefer and click "OK". As in the previous section, an internal Excel window will open.
- Enter the necessary data to validate your chart.
- Close the window and the histogram will be created automatically in Word.
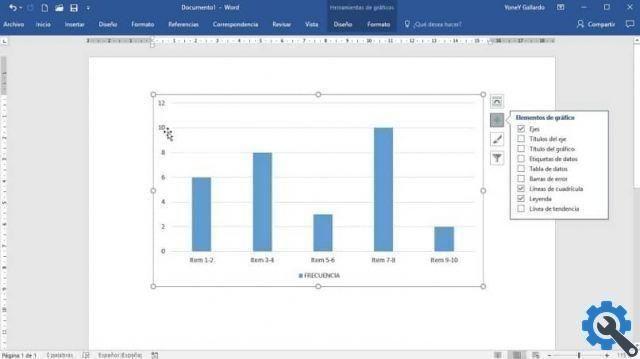
Basically, you can create or insert a histogram with just these three steps in Word. But if you want to customize it even more, that's also possible, as the design options will appear right next to the graphics.
With them you can locate the histogram in line with the text or adapt it to it. You will have three other options to make your graphic appearance sensational, with the most original features.
More options for customizing a histogram in Word
- Chart elements: in this option you will be able to choose what items you want to see or not in your histogram. Check the boxes you prefer and the change will be made.
- Style-Color: There you will find different proposals of bar styles and color combinations that will bring your graphics to life.
- Values-Names: be even more specific about how you want your histogram to locate names and values, associating them with the colors you have previously chosen.
Try all these tips in your Word document, you will notice that it is very easy to create a histogram. Surprise yourself, your teachers and your classmates with the best graphics created in Word.